Basic analysis of Stellar Lumens (XLM) delivers contradictory signals when observing its daily price movements. The token dropped sharply from its November 2024 peak, which caused traders to worry because it broke below the 61.8% Fibonacci Retracement level. The situation does not look promising, but analysts have detected positive indicators suggesting an upcoming market recovery. The market shows conflicting signs about XLM price direction, as it may rise or decline. The market situation appears as follows on April 6, 2025.
The Drop: Fibonacci Fall and a Death Cross Threat
XLM has experienced numerous price drops since reaching its peak value in November 2024, leading to a major loss of market value. The technical level at 61.8% Fib stands as a warning signal, which most bulls wish to stay above since XLM has recently dropped below it. The impending “death cross” situation will develop because the 50-day and 200-day moving averages are slowly moving towards a position where the shorter-term average lies underneath the longer-term average. The signal of longer-term bearish prospects will be activated with the death cross formation.
- Market exhaustion frequently starts after fibres break the 61.8% level, which indicates that sellers are currently controlling the market direction.
- The averages are very near an intersection, although they have not crossed yet. According to X posts, it is crucial to be vigilant because the XLM’s 50/200 MA convergence represents an extreme danger point.
Bullish Whispers: Falling Wedge and Double Bottom Emerge
XLM’s technical chart fails to suggest complete negativity. Thus, investors should push away their feelings of panic. Two time-tested bullish patterns have started to form within the market structure:
When two downward slopes form an ever-tightened wedge formation, the phenomenon becomes known as price compression, which typically results in a breakout. The Pi Network price rally following a comparable falling wedge pattern has boosted prospects for future increases. The upper wedge line of XLM reaches approximately $0.30, so breaking past that level would signal a crucial turning point for the asset.


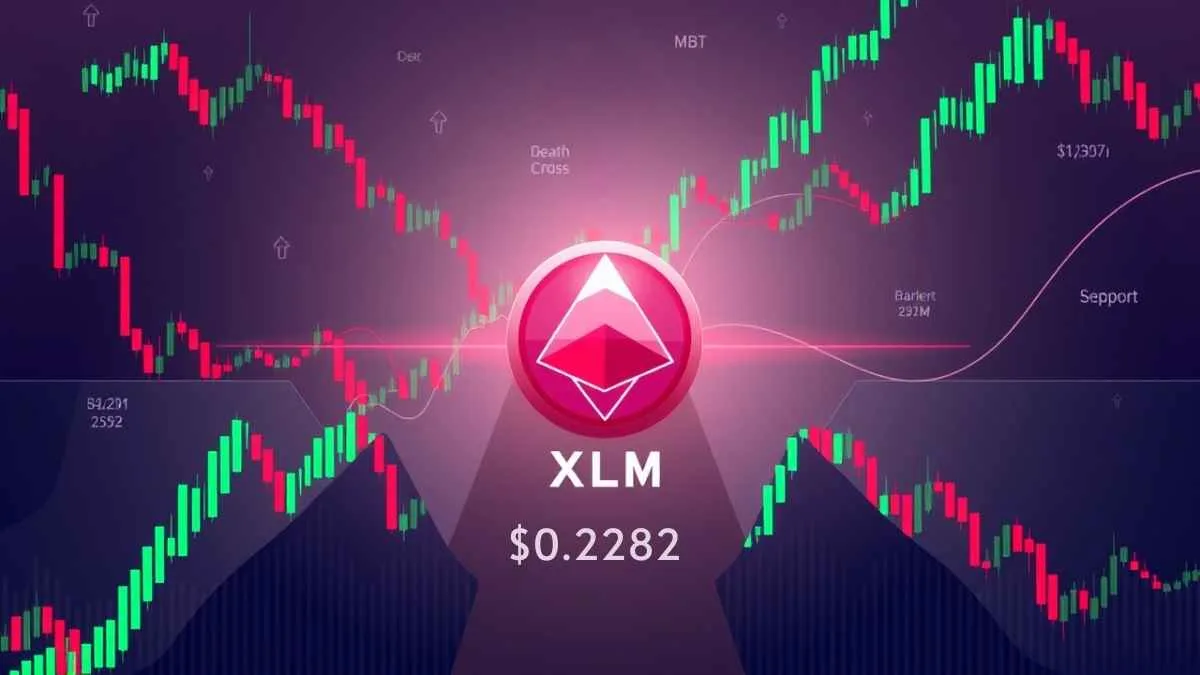
A double bottom pattern has emerged at XLM’s $0.2282 price level, drawing its price to the floor twice before creating a “W” pattern with a neckline at $0.30. When XLM breaks through the neckline, it establishes a significant reversal pattern that could produce price gains up to $0.35 and potentially higher.
A X user declared that falling wedges and double bottoms appeal to traders as sweet treats. XLM shows signs of potential reversal action from its current position because $0.2282 is a vital marker.
XLM has multiple critical points of interest in its price action, including $0.2282 and $0.30.
XLM’s at a crossroads. XLM can accelerate upward when it holds positions above $0.2282 and avoids the death cross pattern. XLM has potential to climb back upward after breaching the $0.30 ceiling which doubles as double-bottom support so that it could reach $0.35 at least before testing November’s monthly highs. The crossover of the 50/200 moving average combined with a break below $0.2282 might trigger bearish pressure that could drive the price to support near $0.20 and potentially reach the 78.6% Fib level below.
- The market will experience a surge in values if XLM sustains above $0.2282, escapes the death cross, and rises beyond $0.30, with a new target at $0.35 and beyond.
- A decrease below $0.2282 triggers a death cross and puts $0.20 in a volatile situation.
Why It Matters Now
Stellar’s market movement is an essential indicator of its overall resilience. XLM faces critical challenges in maintaining its $1.13 billion valuation following the volatile cryptocurrency market conditions during Q1 2025, according to March CoinGecko records. The XLM traders divided their opinions over the double bottom pattern, as one user predicted buying while another thought the death cross would lead to XLM losing value. In the daily chart, investors must contend between bullish belief and bearish fundamental forces for control. Which wins? The price must reach $0.2282 or the moving averages must maintain their relation.